With HomeEasyBudget create graphical reports or tables to analyze your accounts and quickly visualize your expenses and revenue items by category, sub-category, monthly, annually or any other period or criterion at your convenience.
Predefined Reports
HomeEasyBudget offers simple reports already configured for each bank account for quick viewing of your transactions, for a month or a year.
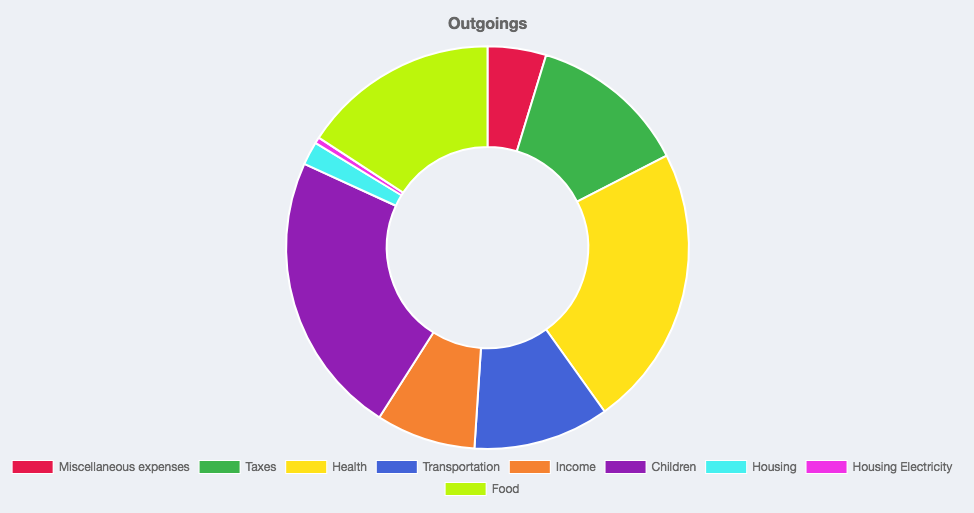
In graphical formats:
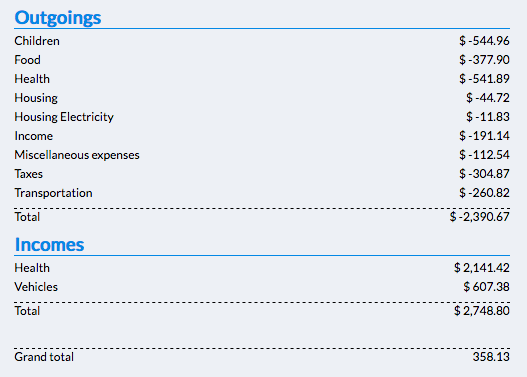
From synthesized tables:
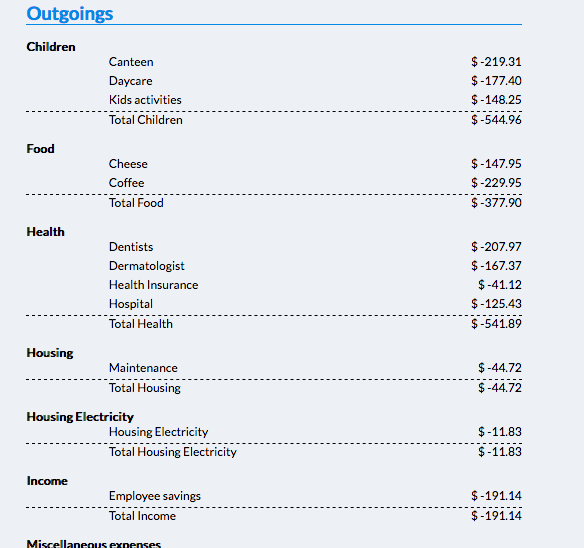
Or categorized tables:
Custom reports
For a more detailed analysis you can also create your own reports on multiple criteria: period, fiscal years, bank accounts, categories, subcategories, amounts, means of payment, third parties, …